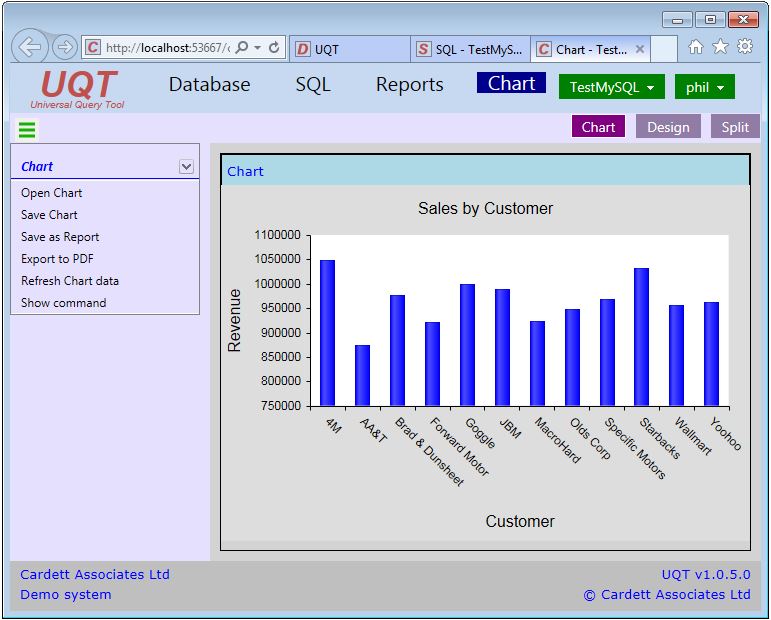
UQT allows you to chart your data.
Building Charts
UQT has a chart designer, where you can specify many aspects of the chart design:
- in this example, the window is in Split mode, with both the chart and the designer visible
- you can build bar charts (vertical and horizontal), pie charts, line charts, area charts and point charts
- you can chart two different columns (one is plotted on the left axis, the other on the right axis)
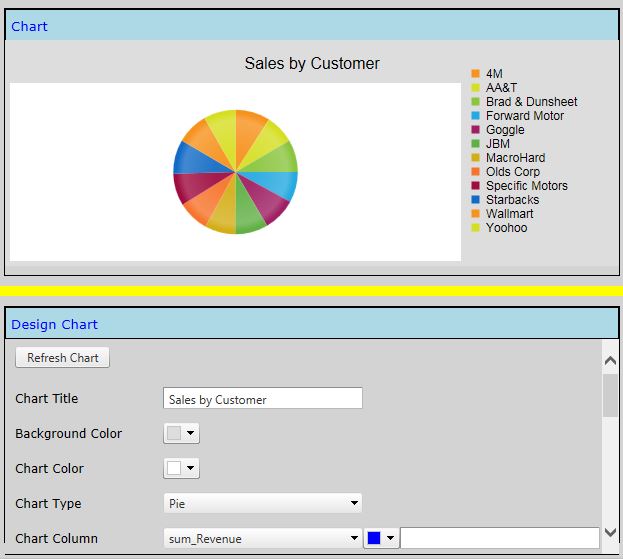 Designing charts in UQT