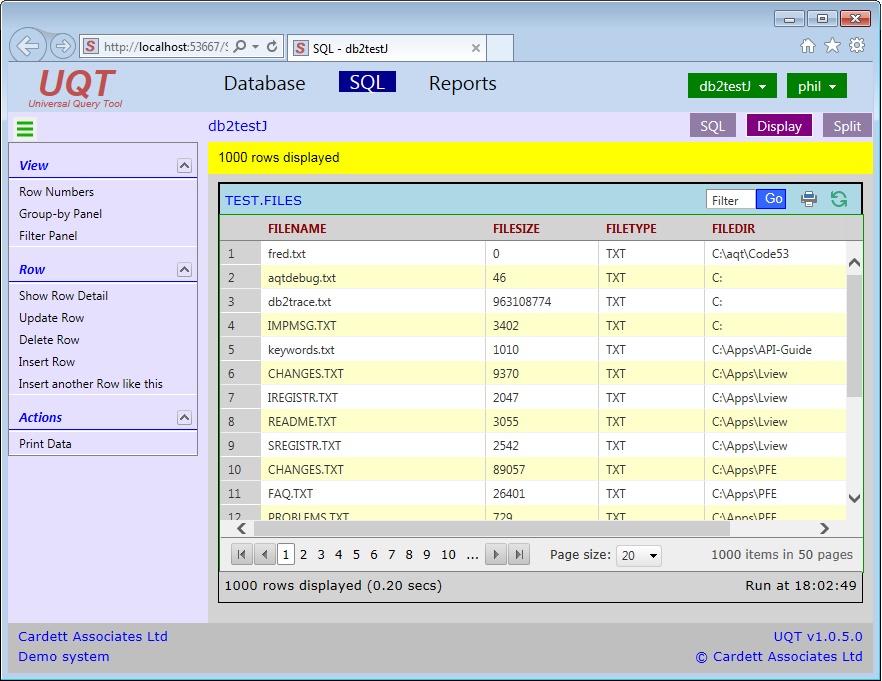
This shows the results of a query or report.
- use the Pager buttons at the bottom of the grid to move through the grid
- click on a column header to sort the data in the grid
- drag the columns to change the column order
 Displaying the results of a query
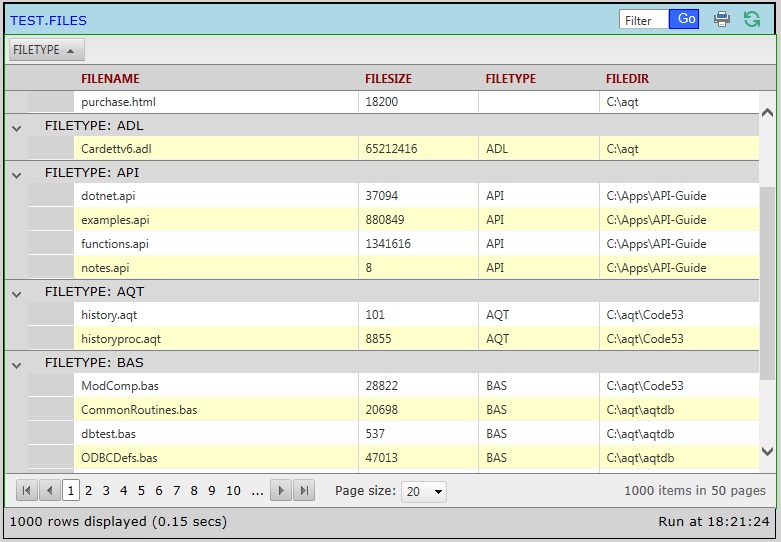
Grouping your Data
When you click on Group by Panel (in the sidepanel) you will be shown a panel above the grid
- drag a column-header to the panel to group the data by that column
- you can group-by multiple columns
 Grouping your data
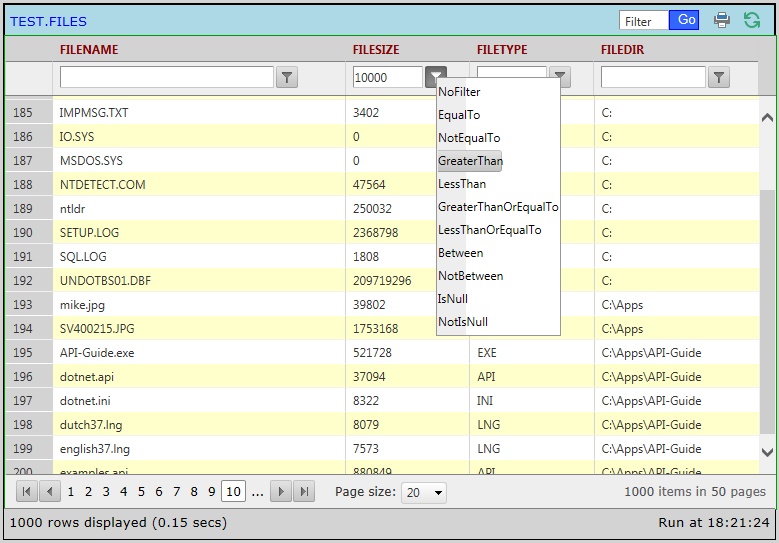
Filtering your Data
When you click on Filter panel (in the side panel) you will be shown the Filter panel
- you can specify a search condition to look for a particular set of rows
- you can select more than one column (rows that match all conditions will be shown)
 Filtering your data
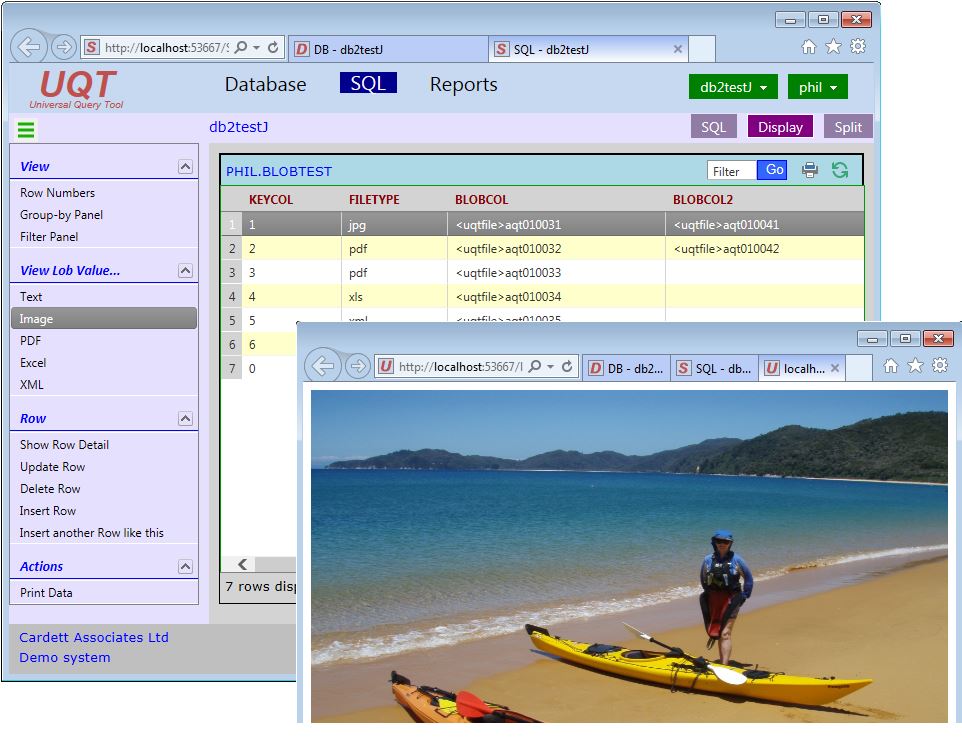
Displaying LOBs
UQT allows you to retrieve and display LOBs (large objects, such as images, pdf files etc).
- UQT will retrieve the LOBs into a set of files
- the View Lob Value items in the panel bar allow you to select how you are to view the LOB
- depending on the file type, it will either be shown in a separate browser tab or downloaded to your device
 Displaying LOBs
